The Completed Projects Report
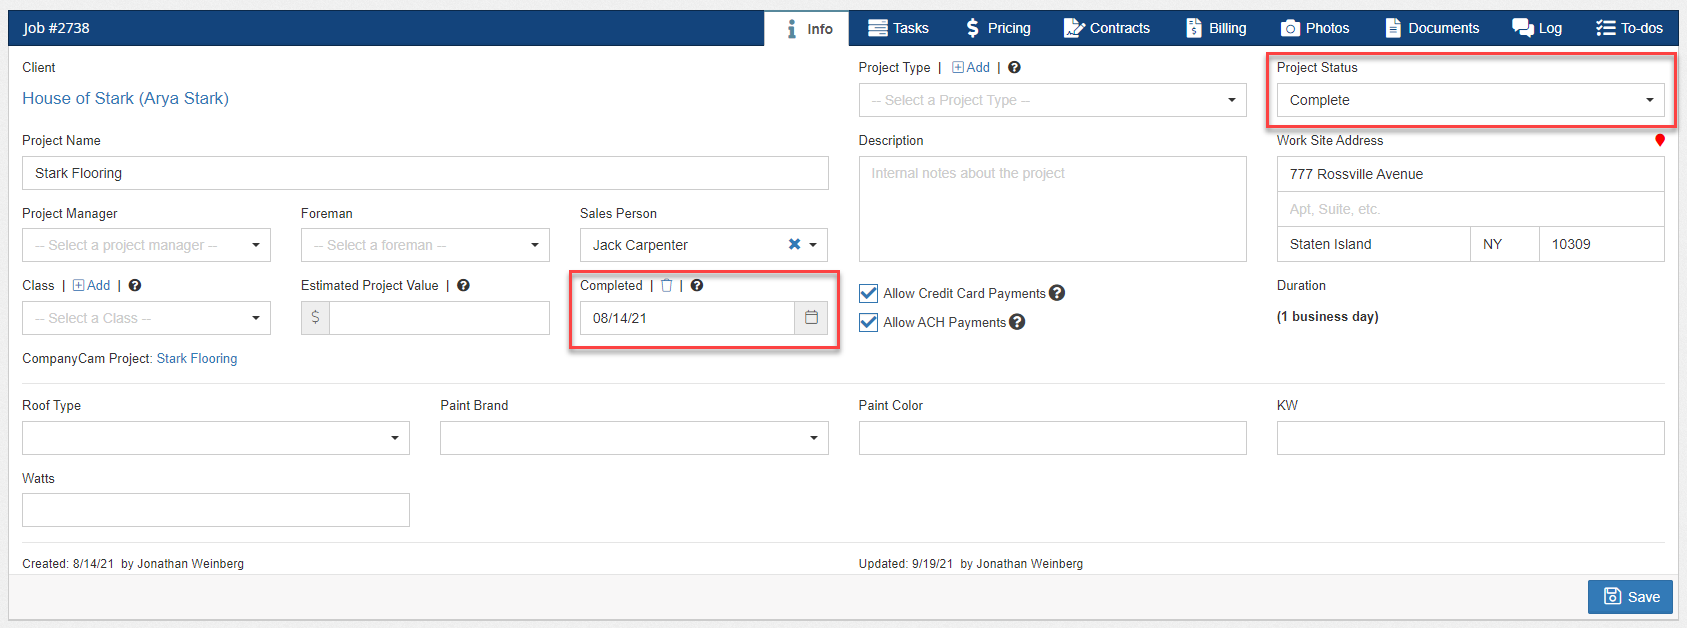
The "Completed Projects" Report shows all finished Projects within a timeframe. A Project is marked complete when its status and completion date are entered.
The Completed Projects Report shows all the projects that are marked as complete in a given time period. A project is considered complete once it has moved to a project status that the system recognizes as being in a state of completion and once the completion date is entered. The app will automatically apply a completion date once the project moves into a completed status, but you can always override it if you need to for any reason. If you are looking to understand more about project statuses and what it means for a status to indicate a project is in a state of completion, please see this article.

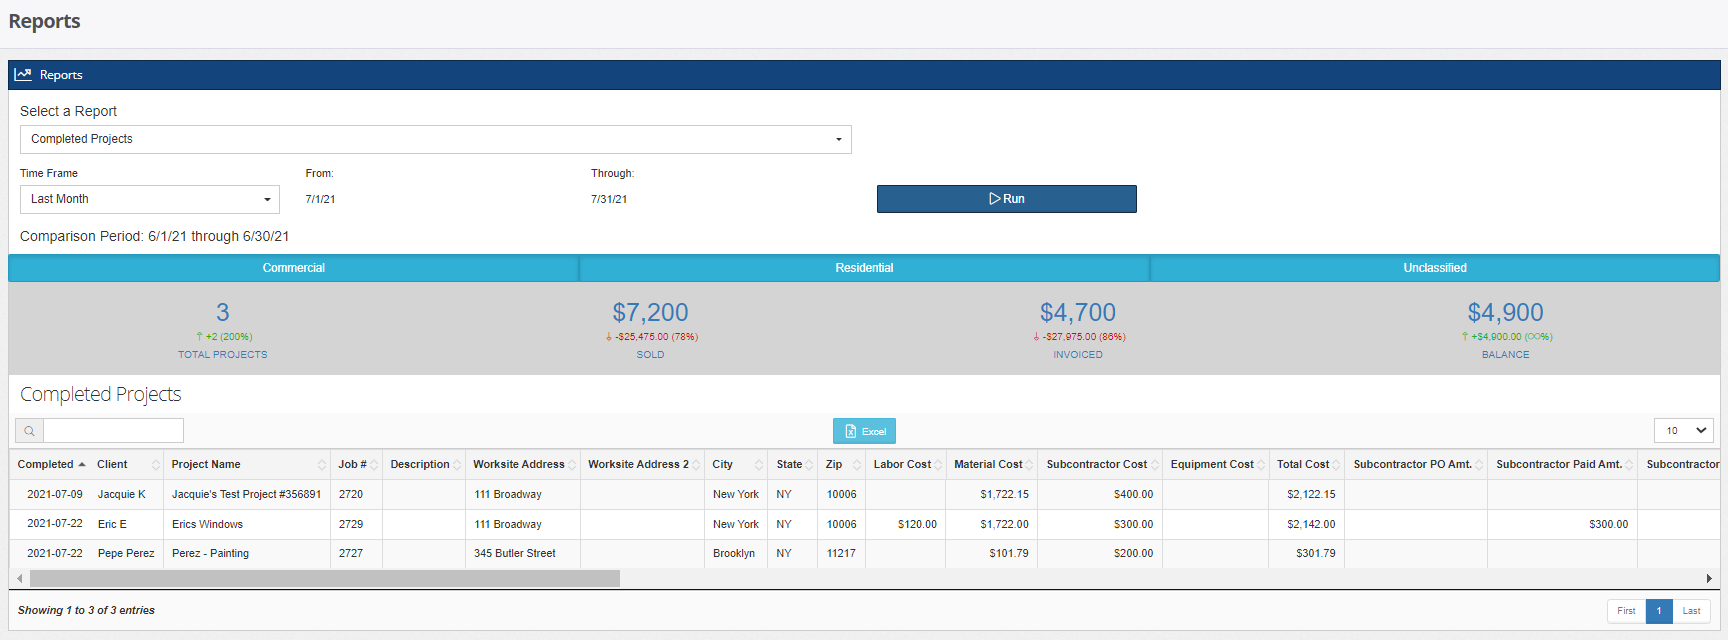
To run the Completed Projects report, head to Reports in the main menu navigation. In this example, we have generated a report for this month. As you can see, the results of the above metrics are shown in the gray bar with the green and red arrows and numbers that help you compare to the prior time period. Here are the descriptions of the summary metrics along the top:
Total Projects: This is the total number of projects that are marked as complete or reached the “Complete” project status.
Sold: This is the total sale amount of all the completed projects.
Invoiced: This is the total of paid and unpaid invoiced amounts from all the completed projects.
Balance: This is the total amount of the remaining balance to be paid for all the completed projects, including any balances that have yet to be invoiced.

Below the summary metrics is the data breakdown of the completed projects within the selected time period. Click on any of the existing records to manage them or download the table into an Excel file by clicking the light blue button at the top of the data table.
In addition to the Completed Projects Report, projects that are marked as complete will be useful in different reports such as Baseline Trends for Completed Projects (Estimates vs. Actuals).
-1.png?width=100&height=75&name=original-tar-ruler%20(1)-1.png)