Lead Performance Report
The Lead Performance report is one of the most powerful tools in Builder Prime. It allows you to break down and analyze how your sales people, lead sources, lead setters, and company as a whole are performing with the leads that are coming in.
In this article, we will discuss what each of the metrics means and how to use this report to get both high-level and detailed views of some of the most important aspects of the business.
Let's start with the top section of the report. It will look something like this:

The first thing to notice is that depending on the Time Frame selected, the system will automatically determine a comparison period to show you how the current numbers compare with the numbers from the comparison period. You can see these comparisons in the screenshot above with the red, green, and black arrows and numbers. The comparison period works with any time frame the is six months or less, and that is not a Custom time frame.
Next, let's dive into the different metrics that are listed in the top row:
- New Opportunities: This is the count of new opportunities created in the system during the selected time frame. If you use the New Client button to create a new lead/opportunity, or simply add a new opportunity to an existing client record, these will count towards the "New Opportunities." If you are looking to understand more about the terminology around clients, leads, and opportunities, check out this article: Terminology for Opportunities, Leads, and Clients
- Rehash Opportunities: This is the count of rehash opportunities created in the system during the selected time frame. Rehash opportunities can only be created if there is a previous opportunity to rehash. Not everyone uses a rehash process, so don't worry if this shows 0 for you. For more on the difference between new and rehash opportunities, check out this article: Terminology for Opportunities, Leads, and Clients
- Appointments Set: This is the count of all the leads that have moved into or beyond the lead status that is designated for the Appointment Set Rate calculation during the selected time frame. More simply, it is the number of appointments that were set in the time frame. Keep in mind that this number is not how many of the opportunities created in this time frame also set appointments, it is just the number of leads that moved into or beyond the Appointment Set status during the time frame, regardless of when the opportunity was first created. Also, note that this is not based on the actual appointment date, it is just when the lead moved into the Appointment Set status.
- Leads Issued: This is the count of all the leads that have moved into or beyond the lead status that is designated for the Lead Issued Rate calculation during the selected time frame. More simply, it is the number of leads that were confirmed or issued out to sales reps in the time frame. By default on new Builder Prime accounts, the Appointment Set lead status is also designated as lead status for Leads Issued since not everyone tracks this separately. You can always add another status to track the lead being issued. Otherwise, this number will always be the same as the number of appointments set since it is based on the same lead status.
- Demos / Appointments Run: This is the count of all the leads that have moved into or beyond the lead status that is designated for the Appointment Run Rate calculation during the selected time frame. More simply, it is the number of demos (or appointments run) during the selected time frame.
- Jobs Sold: This is the count of all leads that have moved into or beyond the lead status that is designated as a sale being made to the client during the selected time frame. More simply, it is the number of jobs sold during the selected time frame.
Next, let's dive into the second row of metrics:
- Appointment Set Rate: This is the percentage of the opportunities created during the selected time frame, and had appointments set (i.e. moved into or beyond the Appointment Set status).
- Lead Issued Rate: This is the percentage of the appointments that were set during the selected time frame, and were issued to sales reps (i.e. moved into or beyond the Lead Issued status).
- Demo (Run) Rate: This is the percentage of the leads that were issued to a sales rep during the selected time frame, and were demo'd or run. (i.e. moved into or beyond the Appointment Run status).
- Close Rate: This is the percentage of leads that had demos or appointments run during the selected time frame, and were sold.
- Net Sales per Lead Issued (NSLI): This is the average sale amount for each lead that was issued to a sales rep. The sale amount is determined based on the sum of all the amounts on contracts within a project that are marked as sold for leads that are issued to sales reps during the selected time frame.
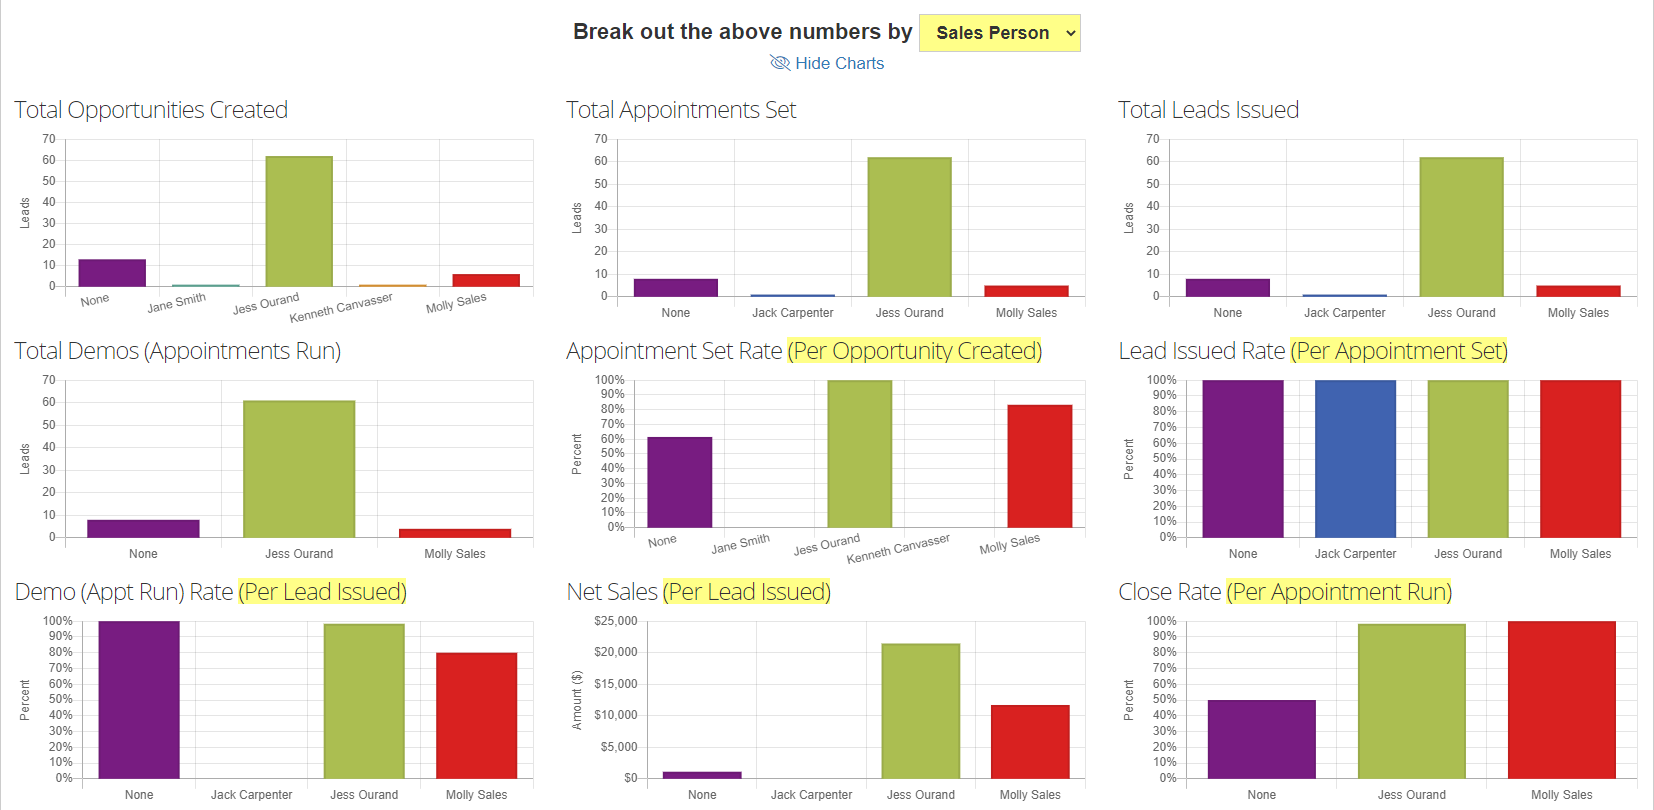
In the next section of the report, we can see how all of these numbers above break down by sales person assigned to the opportunity (i.e. on the client record), the lead setter assigned to the lead, or the lead source assigned to the lead.

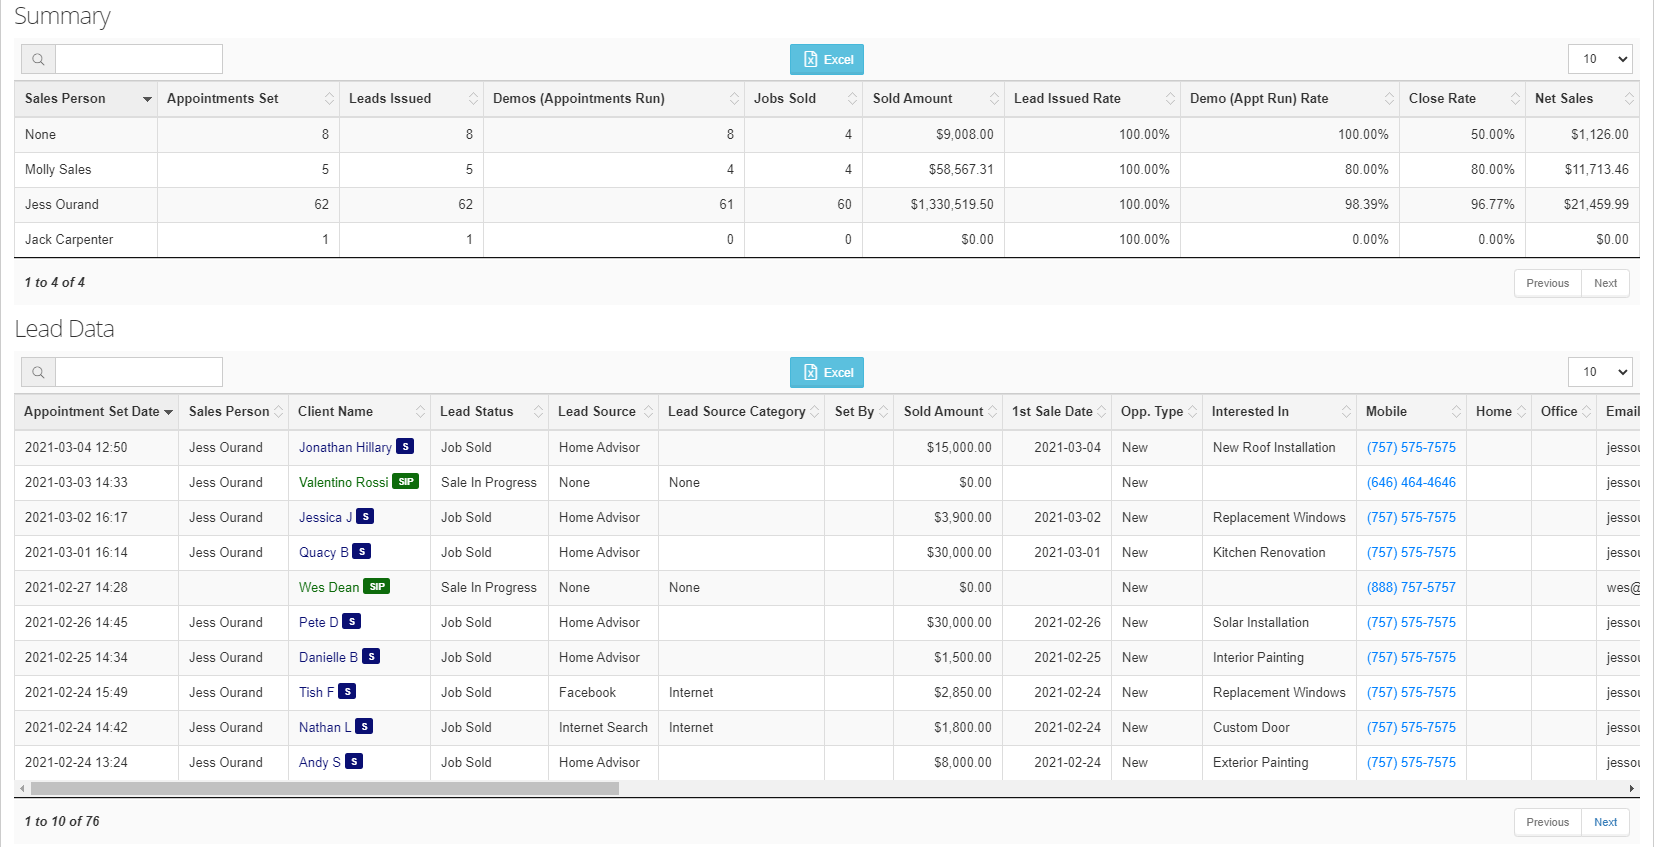
First, you will see the yellow drop-down box where you can change how the numbers get broken out. You also have the ability to hide the charts in case you would rather just focus on the data. The data below the charts will look as follows:

The numbers in the chart will give all the same numbers that make up the charts, but if you hover over the number in the table of data, it will give a brief explanation of the number as well.
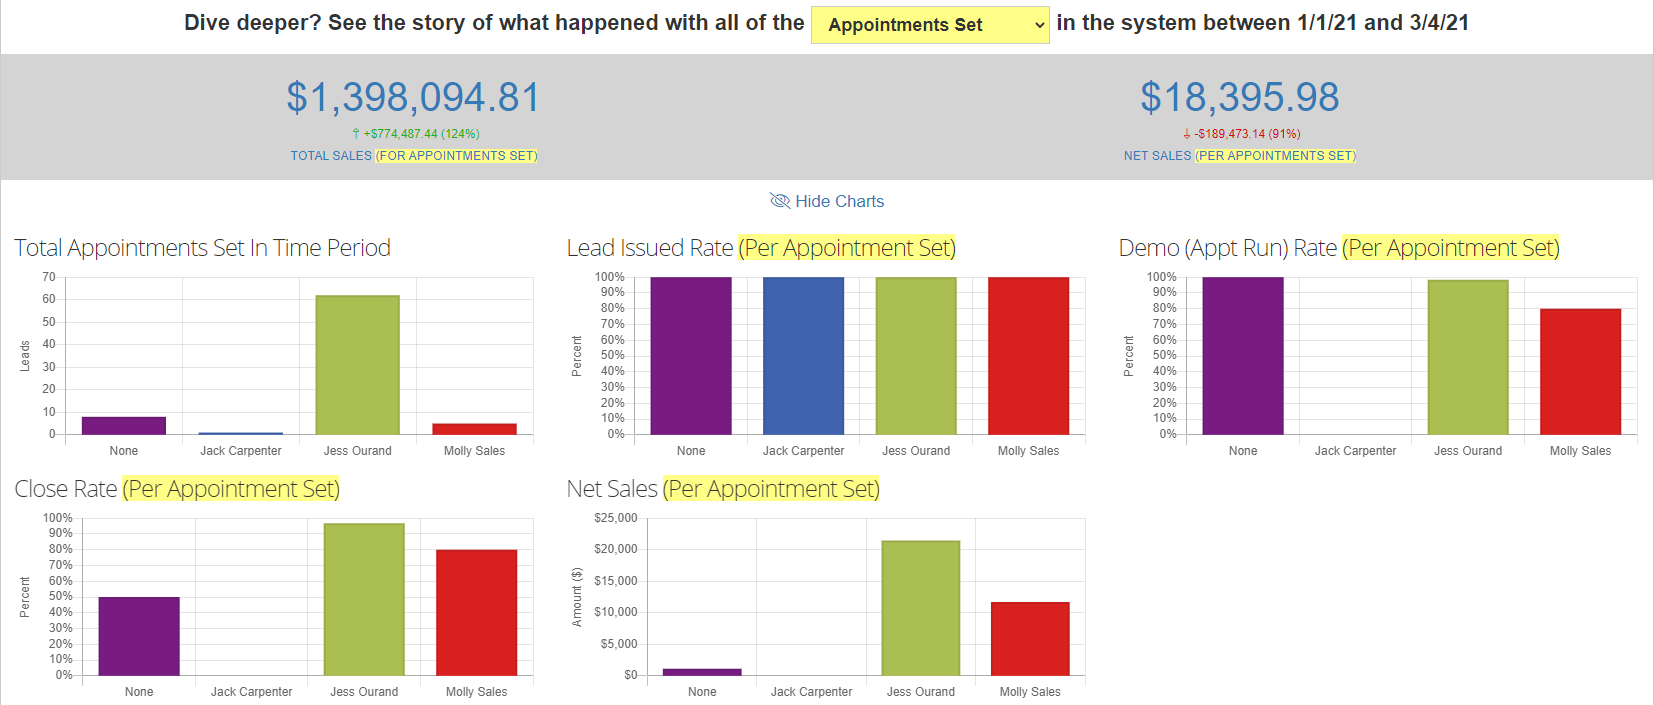
The report actually doesn't end there. You will also have the ability to dive deeper into the numbers to get an understanding of the story behind the leads. The metrics we've discussed so far are the most common metrics that people in this industry care about, but that doesn't mean there aren't other useful ways to analyze things. For example, you may want to trace the opportunities created in a time frame all the way through to see how many of those opportunities had demos or sales. You might also want to see the names or other details of the specific leads that make up all these different numbers. If so, make a selection in the yellow drop down at the bottom of the report to select where in your lead funnel you want to start. In the example just discussed, you would select Opportunities Created in the drop down. If you want to see all of the specific opportunities that had appointments set and then where they ended up, then select Appointment Set in the drop down. Etc.


Depending on your selection for the starting point in the yellow drop-down, it will show all the leads that have progressed to or beyond that lead status during the selected time frame. It will show you the date that they made it to or beyond that status as well. You will see that this always falls within the time frame selected. Then you can see the story of what happened with those leads from that point forward. In this example where we selected Appointment Set as the starting point, notice how the Close Rate is not calculated based on the number of demos anymore. It tells you what percentage of the leads closed based on the leads that had appointments set during the time period. It is less likely you want to look at this for something like the close rate, but could give you some valuable insight nonetheless.
Why the sale amount in this report doesn't match the sale amount in the Total Sales report
People will commonly wonder why the sale amount in this report doesn't match the sale amount when they run the Total Sales report for the same time period. First - don't worry... the sale amounts are not supposed to match! The only way they would match is if you operate on a strict one-call close basis, and never make a sale on a different day than the day you demo. This Lead Performance report looks at sales based on when an event occurred prior to the sale. For example, if you ran the demo in March, and sold the job in April, that sale amount will be reflected in the Lead Performance report for March because that is when you ran the demo, but it will be reflected in the Total Sales report in April because that is when it actually sold. So the time frames in the two reports are used differently, and that's why your sale amounts will not match across the reports. If you are looking strictly for sales, the Lead Performance report is not the right report for that. Run the Total Sales report instead.
-1.png?width=100&height=75&name=original-tar-ruler%20(1)-1.png)