Customer Acquisition Costs by Lead Source Report
Tracking the cost/benefit of your lead generation is made simple through Builder Primes Customer Acquisition Cost by Lead Status Report
Customer Acquisition Costs by Lead Source Report allows you to track how much you’ve spent to acquire leads from a lead source in a given time frame. The report shows you summarized cost information and percentage at the top based on how far the leads have progressed in the pipeline.
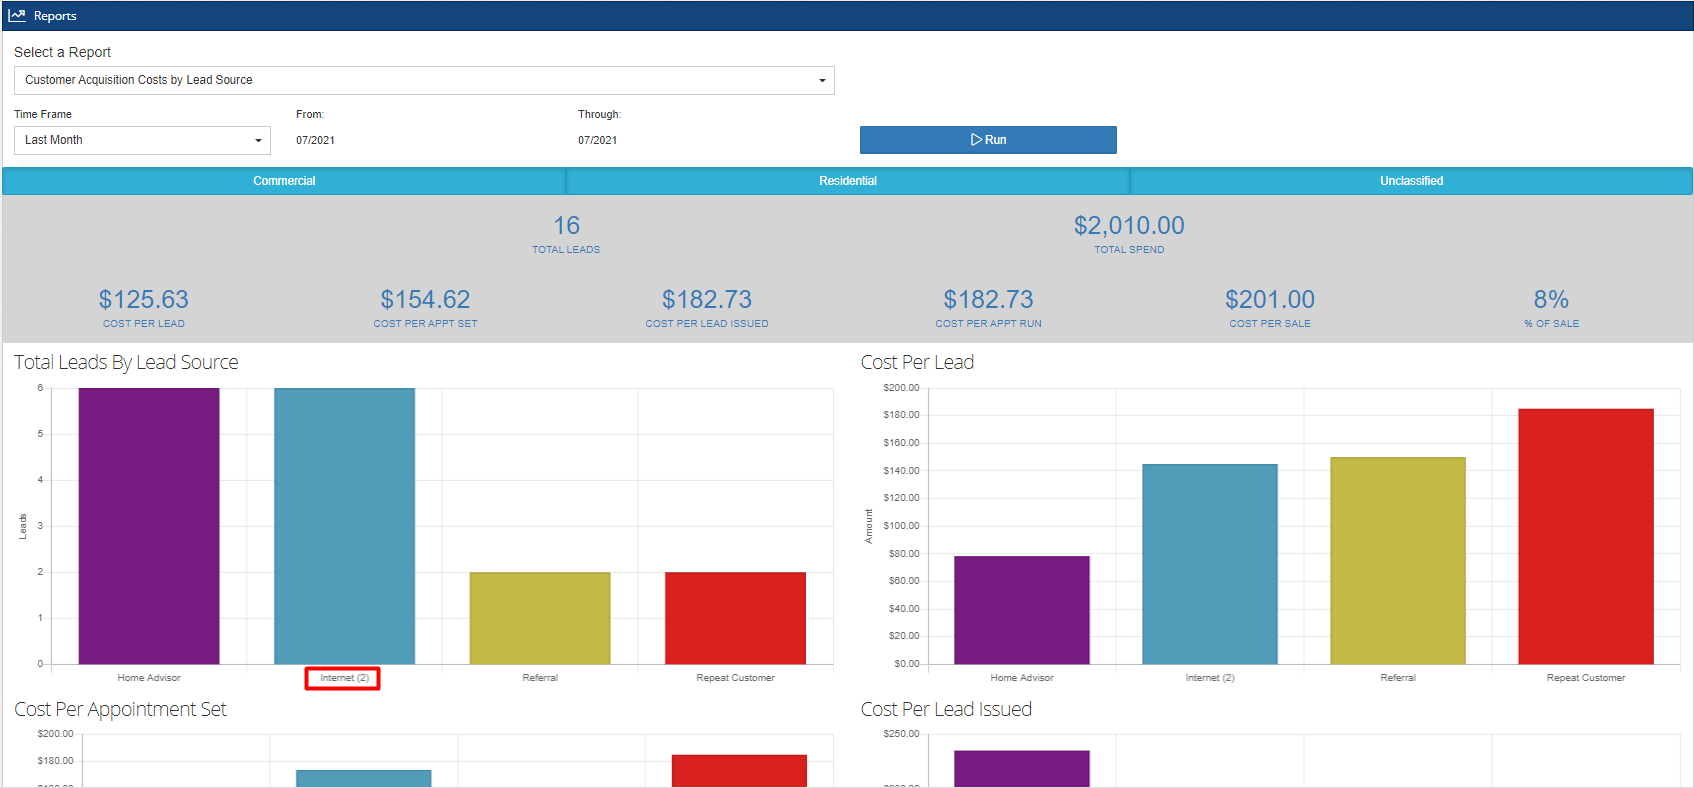
Head to Reports in the main navigation, select Customer Acquisition Costs by Lead Source on the drop-down, then choose a time frame. In this example, we have generated a report for last month.

Before we discuss the key metrics, here are the descriptions of the variables as shown in the charts:
X-axis: This horizontal line shows the lead sources that are responsible for the leads acquired within the given time period. These lead sources are grouped by category (see Admin > Configure > Lead Sources). In this report, we have the following lead sources: Home Advisor, Internet (2), Referral and Repeat Customer.
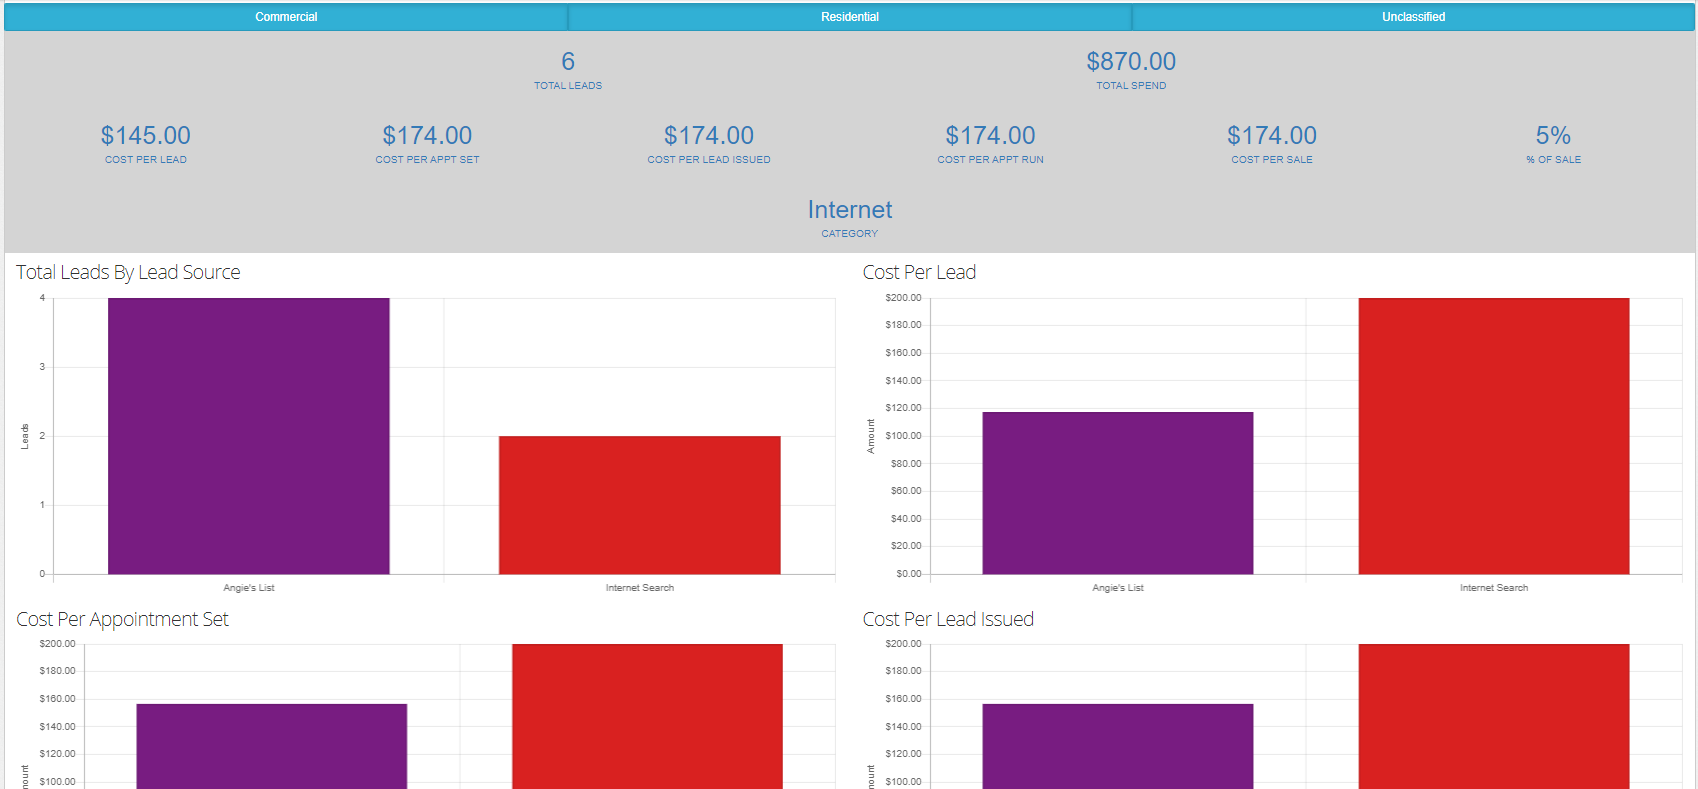
Notice that Internet (2) has a numerical indicator, which means that this category has two lead sources involved. If you click on the bar in the chart for Internet (2), it will drill down into that category and show the 2 lead sources within it, with all the metrics presented in detail. As shown, the lead sources are Angie’s List and Internet Search.

Y-axis: This vertical line shows the scale based on the number of leads acquired by lead source, the amount spent per lead, and the percentage of sales accumulated by the lead sources.
Note: These variables may vary depending on the time frame you select for this type of report.
As you can see, the data are grouped into different graphs according to the metrics indicated in the gray bar. Here are the definitions of the metrics:
Total Leads: This is the number of leads acquired within the selected time period.
Total Spend: This is the total amount of the costs that were spent for customer acquisition in a specific time frame.
Total Leads By Lead Source: This is the first graph you will see in the report. This shows the number of leads generated by specific lead sources which are indicated in the client record.
Note: Leads without a specified lead source will still be included in the report, and will be under the None category along with the lead sources on the horizontal line. Be sure to input the lead source in your client records for better results.
Cost Per Lead: This graph shows the marketing spend for every lead acquired by the designated lead source.
Cost Per Appointment Set: This graph shows the marketing spend for every lead that was set within the time frame, under a designated lead source.
Cost Per Lead Issued: This graph shows the marketing spend by lead sources for the leads that are confirmed or issued out to sales reps in the time frame.
Cost Per Appointment Run: This graph shows the marketing spend by lead sources for the leads that are demoed or moved into or beyond the Appointment Run status during the selected time period.
Cost Per Sale: This graph shows the marketing spend by lead sources for the leads that moved into the status of Jobs Sold during the time frame.
Cost % of Sale Amount: This graph shows the cost percentage by lead sources for leads that made it to the Jobs Sold status within the time period
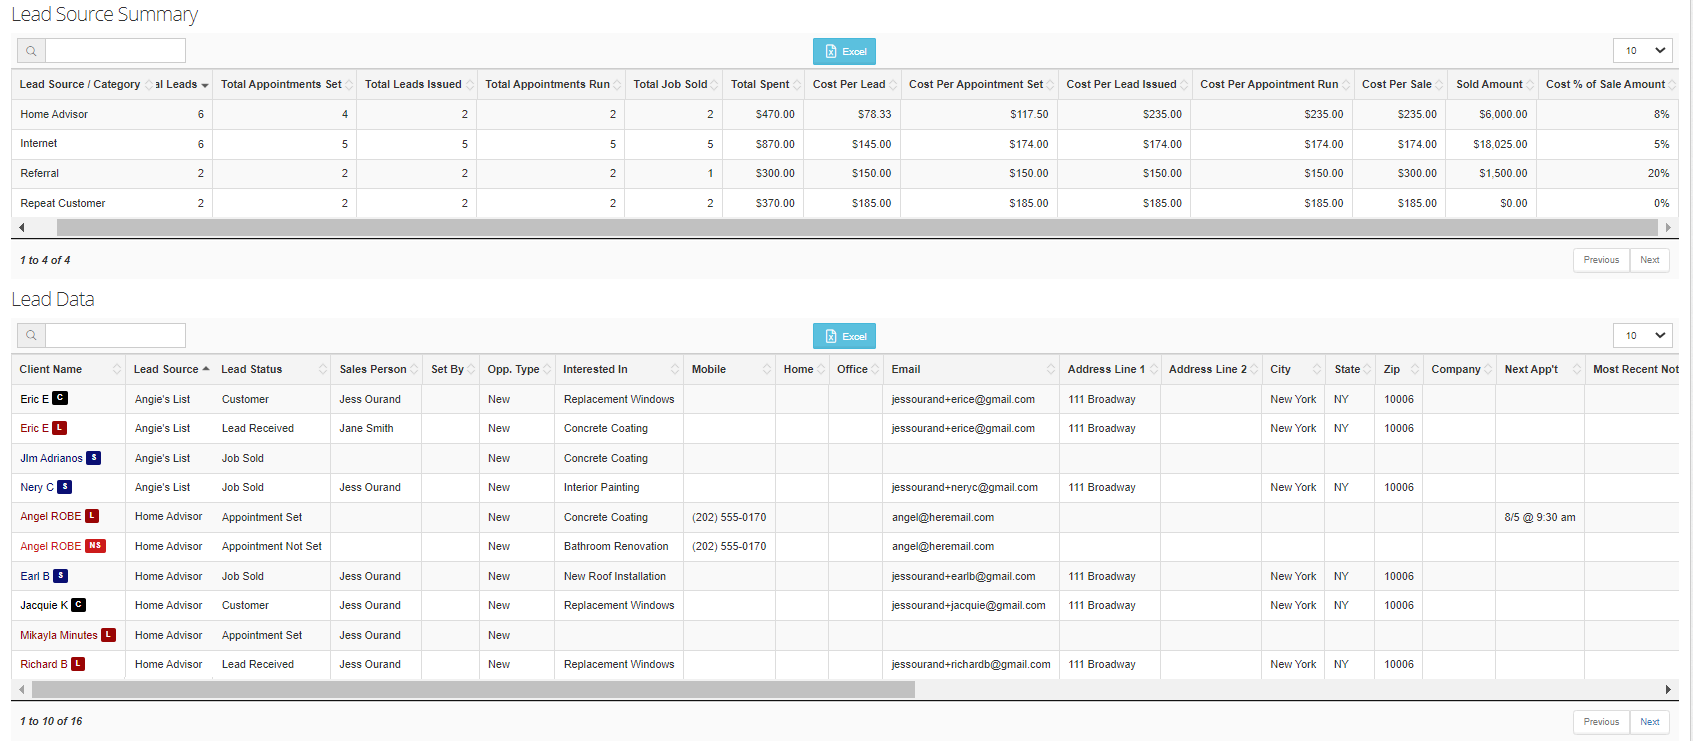
Scroll down to see the data breakdown in the Lead Source Summary table. View or manage any existing client records on the Lead Data table by clicking on the lists or typing on the search bar. You may export the files by clicking the blue Excel button at the top of each table.

-1.png?width=100&height=75&name=original-tar-ruler%20(1)-1.png)