Baseline Trends for Completed Projects (Estimates vs. Actuals) Report
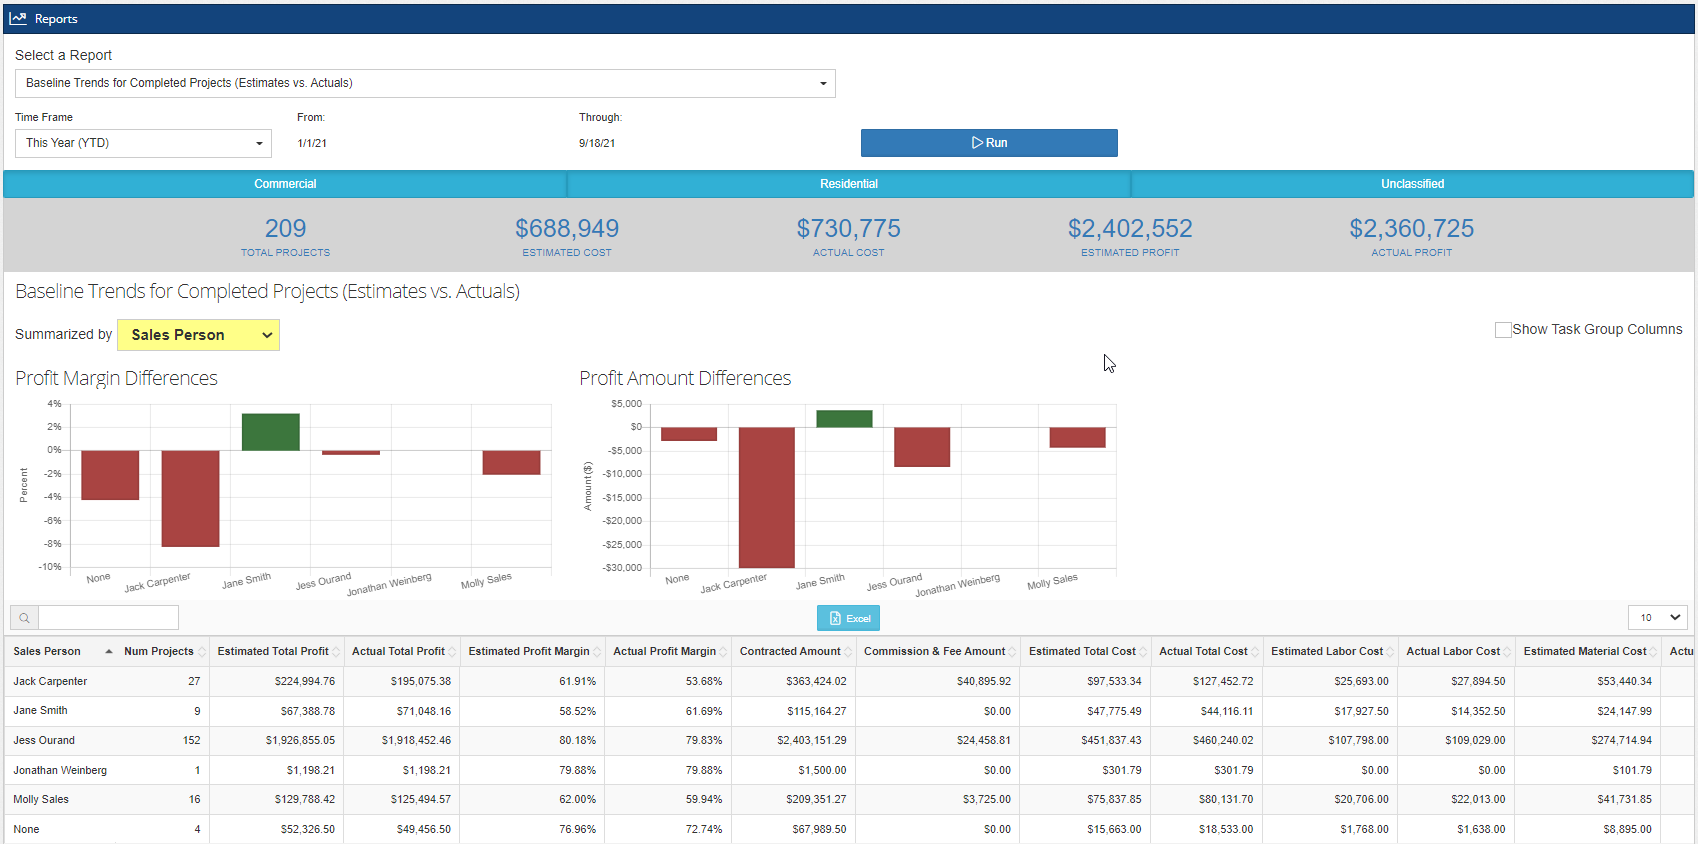
The "Baseline Trends for Completed Projects" report shows profit margin and amount differences for completed projects and summarizes estimated and actual costs and profits in a given period
Baseline Trends for Completed Projects (Estimates vs. Actuals) Report shows the Profit Margin Differences and Profit Amount Differences of the completed projects within the selected time frame. It also shows the summary of the estimated cost, actual cost, estimated profit, and actual profit in the given time period.
If you’re looking to understand how to create project baselines and generate a comparison report for an individual project, please see this article. project-baseline-comparison-estimates-vs-actuals-report
Here are the descriptions of the two graphs shown in this report:
Profit Margin Differences: This is the percentage of the company’s net income divided by the total sales generated within the selected date range.
Profit Amount Differences: This is the amount of the company’s net income divided by the total sales generated within the selected date range.
You can also change the perspective of the report by clicking on the yellow “Summarized by” drop-down field below the gray bar. The table shows the data breakdown of the report based on the category you selected. Export the data into an Excel file by clicking on the light blue button at the top of the table.

Scroll down to view the projects that are completed within the selected time frame. Click on the records to manage them directly in the Tasks tab of the project record screen. Toggle the checkbox on the upper right side of the screen to “Show Task Group Columns” in the Project Details Table.

-1.png?width=100&height=75&name=original-tar-ruler%20(1)-1.png)